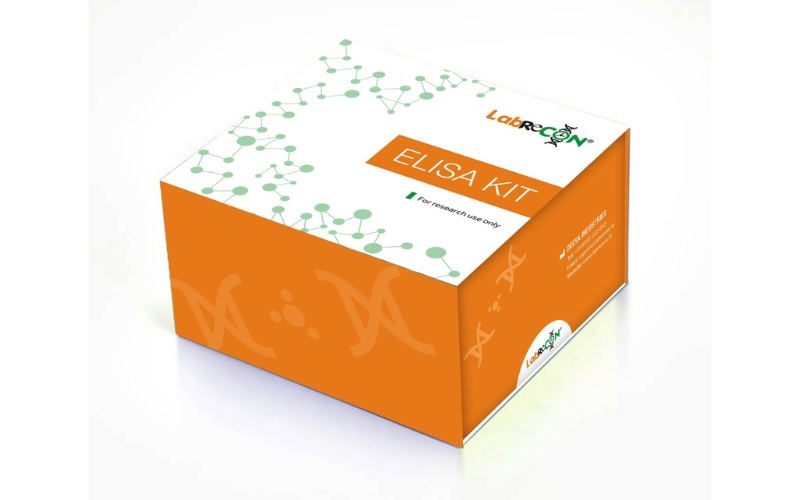
Lablisa® FastTrack Human IL-6(Interleukin 6) ELISA Kit


Product Information
- Description
- More Infomation
This assay has high sensitivity and excellent specificity for detection of Human IL-6. No significant cross-reactivity or interference between Human IL-6 and analogues was observed.
| Product name: | Lablisa® FastTrack Human IL-6(Interleukin 6) ELISA Kit |
| Reactivity: | Human |
| Alternative Names: | B-cell differentiation factor, B-cell stimulatory factor 2, BSF2, BSF-2, CDF, CTL differentiation factor , HSF, hybridoma growth factor, IFNB2, IFN-beta-2, IL6, IL-6, Interferon beta-2, interleukin 6 (interferon, beta 2), interleukin BSF-2, interleukin-6, MGI-2A |
| Assay Type: | Sandwich |
| Sensitivity: | 0.81 pg/mL |
| Standard: | 100 pg/mL |
| Range: | 1.57-100 pg/mL |
| Sample Type: | Serum, Plasma, Tissue homogenate and Other biological samples;Sample Volume=50μL |
| Assay Length: | 1.5h |
| Research Area: | Enzyme & Kinase;Metabolic pathway;Hepatology; |
Standard curve

| Concentration (ng/mL) | OD | Corrected OD |
|---|---|---|
| 100.00 | 2.366 | 2.311 |
| 50.00 | 1.564 | 1.509 |
| 25.00 | 0.961 | 0.906 |
| 12.50 | 0.529 | 0.474 |
| 6.250 | 0.274 | 0.219 |
| 3.130 | 0.159 | 0.104 |
| 1.570 | 0.098 | 0.043 |
| 0.00 | 0.055 | 0.000 |
Precision
Intra-assay Precision (Precision within an assay):CV%<8%
Three samples of known concentration were tested twenty times on one plate to assess intra-assay precision.
Inter-assay Precision (Precision between assays):CV%<10%
Three samples of known concentration were tested in forty separate assays to assess inter-assay precision.
Recovery
Matrices listed below were spiked with certain level of recombinant Human IL-6 and the recovery rates were calculated by comparing the measured value to the expected amount of Human IL-6 in samples.
| Matrix | Recovery range | Average |
|---|---|---|
| serum(n=8) | 82-95% | 88% |
| EDTA plasma(n=8) | 95-107% | 101% |
| Heparin plasma(n=8) | 94-107% | 100% |
Linearity
The linearity of the kit was assayed by testing samples spiked with appropriate concentration of Human IL-6 and their serial dilutions. The results were demonstrated by the percentage of calculated concentration to the expected.
| Matrix | 1:2 | 1:4 | 1:8 | 1:16 |
|---|---|---|---|---|
| serum(n=8) | 93-102% | 81-96% | 93-106% | 82-95% |
| EDTA plasma(n=8) | 92-101% | 87-98% | 85-92% | 80-96% |
| Heparin plasma(n=8) | 86-96% | 93-104% | 89-97% | 85-94% |
Manuals on the web are for your reference only, specifications are subject to the delivery manuals.


