Lablisa® Human α-CTx(Alpha Crosslaps) ELISA Kit
Product Information
- Description
- More Infomation
This ELISA kit uses the Competitive-ELISA principle. The micro ELISA plate provided in this kit has been pre-coated with Human α-CTx. During the reaction, Human α-CTx in the sample or standard competes with a fixed amount of Human α-CTx on the solid phase supporter for sites on the Biotinylated Detection Ab specific to Human α-CTx. Excess conjugate and unbound sample or standard are washed away, and Avidin-Horseradish Peroxidase (HRP) conjugate are added to each micro plate well and incubated. Then a TMB substrate solution is added to each well. The enzyme-substrate reaction is terminated by the addition of stop solution and the color turns from blue to yellow. The optical density (OD) is measured spectrophotometrically at a wavelength of 450 nm ± 2 nm. The concentration of Human α-CTx in tested samples can be calculated by comparing the OD of the samples to the standard curve.
| Product name: | Lablisa® Human α-CTx(Alpha Crosslaps) ELISA Kit |
| Reactivity: | Human |
| Alternative Names: | a-CTXI, aCTX-I, A-Cr, Type I Collagen C-Telopeptide-Related Fraction |
| Assay Type: | Competitive |
| Sensitivity: | 56.25 pg/mL |
| Standard: | 6000pg/mL |
| Range: | 93.75-6000pg/mL |
| Sample Type: | Serum, Plasma, Tissue homogenate and Other biological samples;Sample Volume=50μL |
| Assay Length: | 1.5H |
| Research Area: | Tumor immunity; |
Standard curve
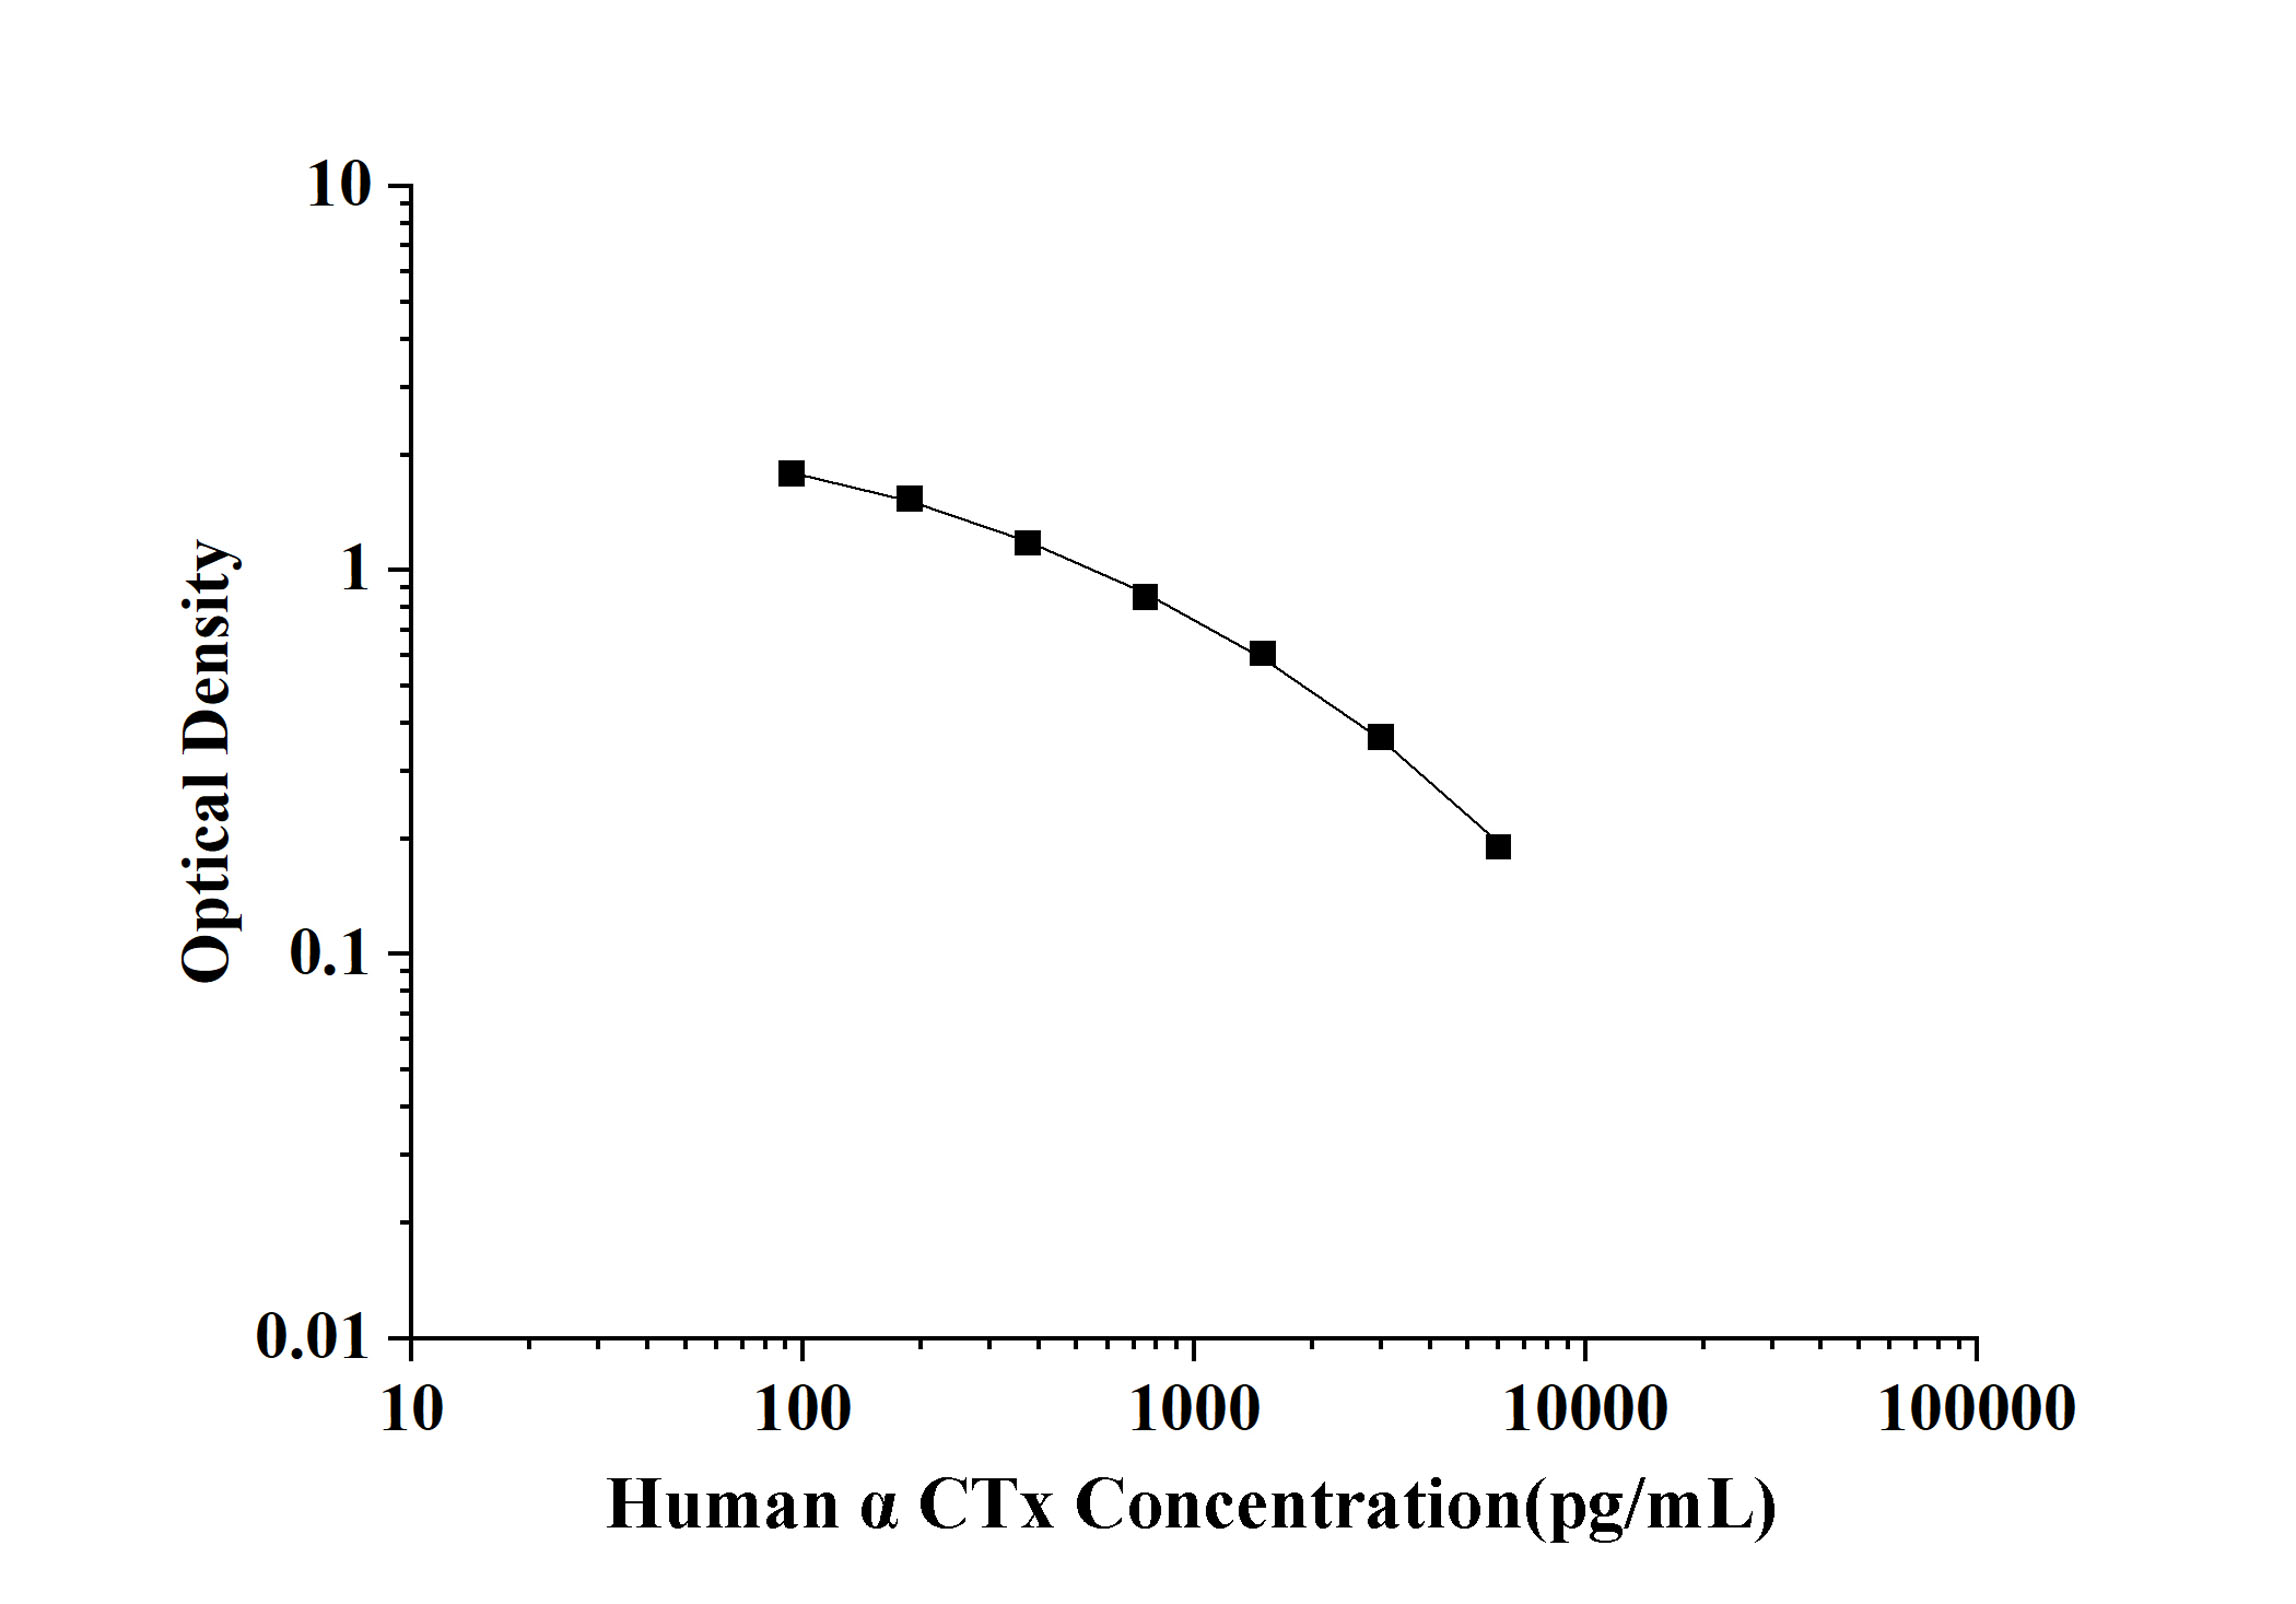
| Concentration (ng/mL) | OD |
|---|---|
| 6000.00 | 0.205 |
| 3000.00 | 0.383 |
| 1500.00 | 0.622 |
| 750.00 | 0.867 |
| 375.00 | 1.192 |
| 187.50 | 1.551 |
| 93.75 | 1.796 |
| 0.00 | 2.556 |
Precision
Intra-assay Precision (Precision within an assay): 3 samples with low, mid range and high level were tested 20 times on one plate, respectively.
Inter-assay Precision (Precision between assays): 3 samples with low, mid range and high level were tested on 3 different plates, 20 replicates in each plate, respectively.
Recovery
The recovery of spiked at three different levels in samples throughout the range of the assay was evaluated in various matrices.
| Matrix | Recovery range | Average |
|---|---|---|
| Serum (n=8) | 90-105% | 97% |
| EDTA plasma (n=8) | 88-102% | 95% |
| Cell culture media (n=8) | 82-97% | 89% |
Linearity
Samples were spiked with high concentrations of target proteins and diluted with Reference Standard & Sample Diluent to produce samples with values within the range of the assay.
| Matrix | 1:2 | 1:4 | 1:8 | 1:16 |
|---|---|---|---|---|
| serum(n=5) | 89-98% | 81-94% | 96-105% | 92-103% |
| EDTA plasma(n=5) | 87-98% | 87-98% | 92-105% | 95-107% |
| Cell culture media(n=5) | 82-96% | 81-94% | 93-107% | 93-102% |
Manuals on the web are for your reference only, specifications are subject to the delivery manuals.