Lablisa® Mouse LEP(Leptin) ELISA Kit
Product Information
- Description
- More Infomation
The test principle applied in this kit is Sandwich enzyme immunoassay. The microtiter plate provided in this kit has been pre-coated with an antibody specific to Mouse LEP. Standards or samples are added to the appropriate microtiter plate wells then with a biotin-conjugated antibody specific to Mouse LEP. Next, Avidin conjugated to Horseradish Peroxidase (HRP) is added to each microplate well and incubated. After TMB substrate solution is added, only those wells that contain Mouse LEP, biotin-conjugated antibody and enzyme-conjugated Avidin will exhibit a change in color. The enzyme-substrate reaction is terminated by the addition of sulphuric acid solution and the color change is measured spectrophotometrically at a wavelength of 450nm ± 10nm. The concentration of Mouse LEP in the samples is then determined by comparing the OD of the samples to the standard curve.
| Product name: | Lablisa® Mouse LEP(Leptin) ELISA Kit |
| Reactivity: | Mouse |
| Alternative Names: | OB; OBS; Obesity Homolog; Obesity Factor; Obese Protein |
| Assay Type: | Sandwich |
| Sensitivity: | 0.056 ng/mL |
| Standard: | 10 ng/mL |
| Detection Range: | 0.16-10 ng/mL |
| Sample Type: | serum, plasma, tissue homogenates, cell lysates, cell culture supernates and other biological fluids |
| Assay Length: | 3.5h |
| Research Area: | Metabolic pathway;Endocrinology;Cardiovascular biology; |
Standard curve
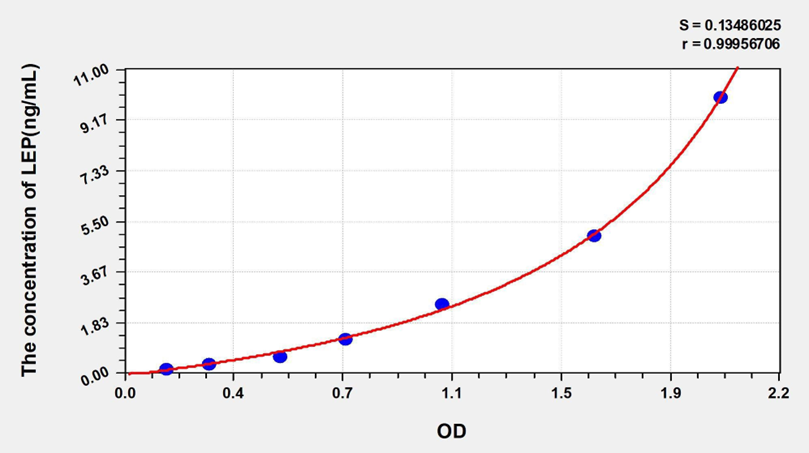
| Concentration (ng/mL) | OD | Corrected OD |
|---|---|---|
| 10.00 | 2.121 | 2.023 |
| 5.00 | 1.694 | 1.596 |
| 2.50 | 1.177 | 1.079 |
| 1.25 | 0.847 | 0.749 |
| 0.63 | 0.625 | 0.527 |
| 0.32 | 0.384 | 0.286 |
| 0.16 | 0.238 | 0.140 |
| 0.00 | 0.098 | 0.000 |
Precision
Intra-assay Precision (Precision within an assay):CV%<8%
Three samples of known concentration were tested twenty times on one plate to assess intra-assay precision.
Inter-assay Precision (Precision between assays):CV%<10%
Three samples of known concentration were tested in forty separate assays to assess inter-assay precision.
Recovery
Matrices listed below were spiked with certain level of recombinant LEP and the recovery rates were calculated by comparing the measured value to the expected amount of LEP in samples.
| Matrix | Recovery range | Average |
|---|---|---|
| serum(n=5) | 92-106% | 99% |
| EDTA plasma(n=5) | 77-95% | 86% |
| Heparin plasma(n=5) | 88-103% | 95% |
Linearity
The linearity of the kit was assayed by testing samples spiked with appropriate concentration of LEP and their serial dilutions. The results were demonstrated by the percentage of calculated concentration to the expected.
| Matrix | 1:2 | 1:4 | 1:8 | 1:16 |
|---|---|---|---|---|
| serum(n=5) | 87-96% | 92-105% | 89-102% | 92-101% |
| EDTA plasma(n=5) | 79-93% | 89-97% | 85-94% | 87-101% |
| Heparin plasma(n=5) | 86-94% | 85-95% | 89-99% | 85-95% |
Manuals on the web are for your reference only, specifications are subject to the delivery manuals.